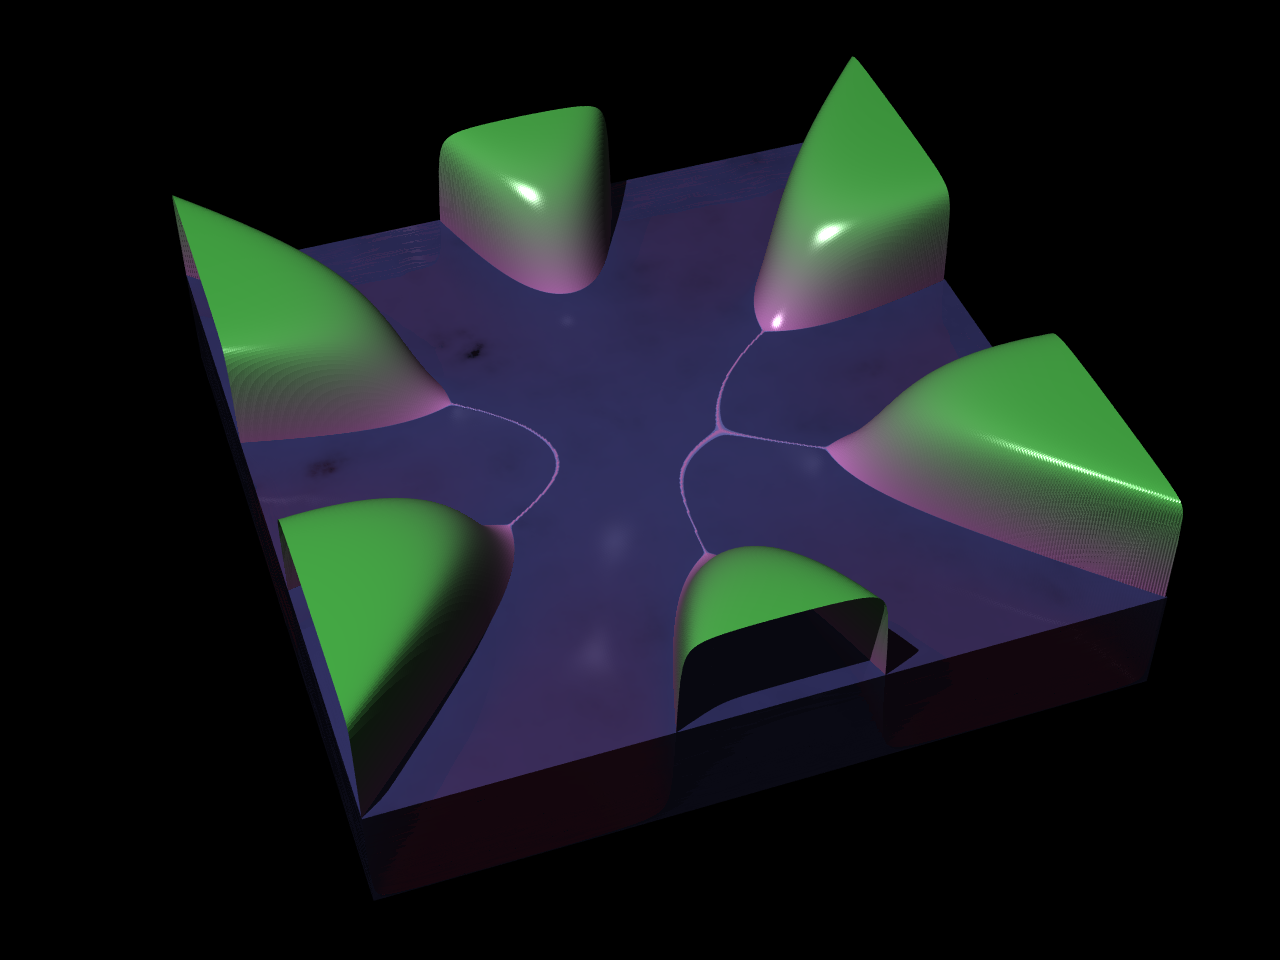
Here below you see the surface of the
real part of the g-function for the potential
![]() and some choice of contours of integration.
and some choice of contours of integration.
![]()
The animations are made frame-by-frame with some Octave code of my production. They are then converted to jpg and into a compressed mpeg4 (or some similar format) using mencoder. All software used is open source.
Mac Users: you may need the QuickTime plugin Flip4Mac
that is available for free (install it and quit Safari, then
reopen).
Windows users: you are on your own, sorry!
An admissible
Boutroux curve with fixed external potential of degree 5 and
varying total mass of the equilibrium (positive) measure:
to know
where the measure is supported you have to look at the tree and
prune all the open legs and keep pruning until you only have one or
tri-valent vertices.
Another one with potential of degree 7: at the beginning the curve is ``inadmissible'' (i.e. the measure is a signed measure supported on the arcs obtained from the pruning above); after the last phase transition the curve is and remains admissible (namely with positive measure).
Yet another one, with potential of degree 12 (this one has a complex potential, so the tree has no symmetry around the real axis).
The Boutroux curve for the Painleve
II equation (Potential
![]() and T=0. Here “time” is
and T=0. Here “time” is
![]() )
)
The ``blurred'' lines in the inmost parts of the tree are just numerical artifacts; ideally the arcs should cleanly connect the vertices (marked with little crosses).
|
|
In the two animations that are (should be) running on the left you see a typical transition. When the saddle point (the node with four legs) intersects the cut the first solution glues to the second solution. The potential is fixed to
and the total charge (mass of the measure) is T ranging from 3 down to 1 in both animations. |
Another example for a degree 4 potential is found here